Comprehensive analysis of environmental data to identify trends and gain insights
- Sufficiency and power analysis to determine the strengths and limitations of a data set
- Statistical analysis of water quality data to monitor pollutants
- Trend analysis to detect changes in invertebrate communities over time
- State of the resource reporting to quantify the health of a watershed
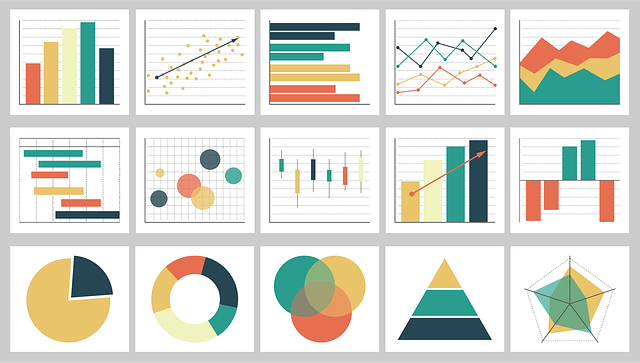
Analysis are supported by clear and informative visual representations of data
- Maps when spatial representation matters in the data
- Distributions when you have lots and lots of data points and want to study where and how the data points are distributed
- Correlations identify relationships among multiple variables
- Rankings compare the position or performance of multiple items with respect to each other